Most business owners know that having a website is important. It’s the thing that tells your audience and potential clients that you're professional and legit.
It provides an extra sense of credibility that sometimes solely relying on social media can’t do.
That’s one of the main reasons that I encourage EVERYONE to build and launch a website as soon as they can…
after you do these 9 things of course!
And I get it – sometimes it feels like a massive undertaking and a project that will take you yearssss to complete.
But the sooner that you can get SOMETHING launched into the world – even if it’s not exactly what you want it to be right away – the sooner you can tweak, refine, and refresh it to be the thing that becomes your employee of the year.
And yes, I’m referring to your website as being an employee.
Because when you build it to work for YOU, it’s the thing that works while you’re sleeping, while you’re on vacation, or even when you’re taking a well deserved personal day.
But the question is – how do you know if your website is truly working for you? How do you know what needs to be tweaked, refined, or refreshed?
To put it simply: you track it!
Having a website is one thing, but making sure that it’s working optimally is another. And I know what you might be thinking… “Great, another thing I have to add to my already mile long to-do list.”
While I know that tracking your website data can feel like just another thing you have to do as a business owner, it’s actually more simple than you think!
In this blog post, you’ll learn the ins and outs of how to track your website data so that you can effectively determine your website's overall success.
I’ll be covering:
- What website metrics to track inside Google Analytics
- How to track them consistently with ease
- What to do with the data once you have it
Let’s dive in. ⬇️
The Best Metrics to Track for Website Success
What Website Metrics To Track Inside Google Analytics
When it comes to tracking your website metrics, the most important thing that you consider is your goals and what is most important for you specifically.
There are LOTS of things that you can track, but that doesn't necessarily mean that you have to track all of it.
Instead, think about the goals you have for your website specifically and then back into your data from there.
Generally speaking, most people are interested in knowing how many visitors their site is attracting, where that traffic is coming from, how visitors are using your site and what pages people are visiting most.
With this in mind, here’s a quick guide on how to track your website data using Google Analytics based on common questions that you likely have.
If you’re unfamiliar with Google Analytics, it’s the platform that provides a wide range of metrics and reports to help you analyze the overall performance of your website.
This platform is free and anyone can create an account – and if you have a website, you SHOULD be using this tool.
How many people are visiting my site?
In Google Analytics, you can easily find this number by navigating to Reports > Life Cycle > Acquisition > Overview.
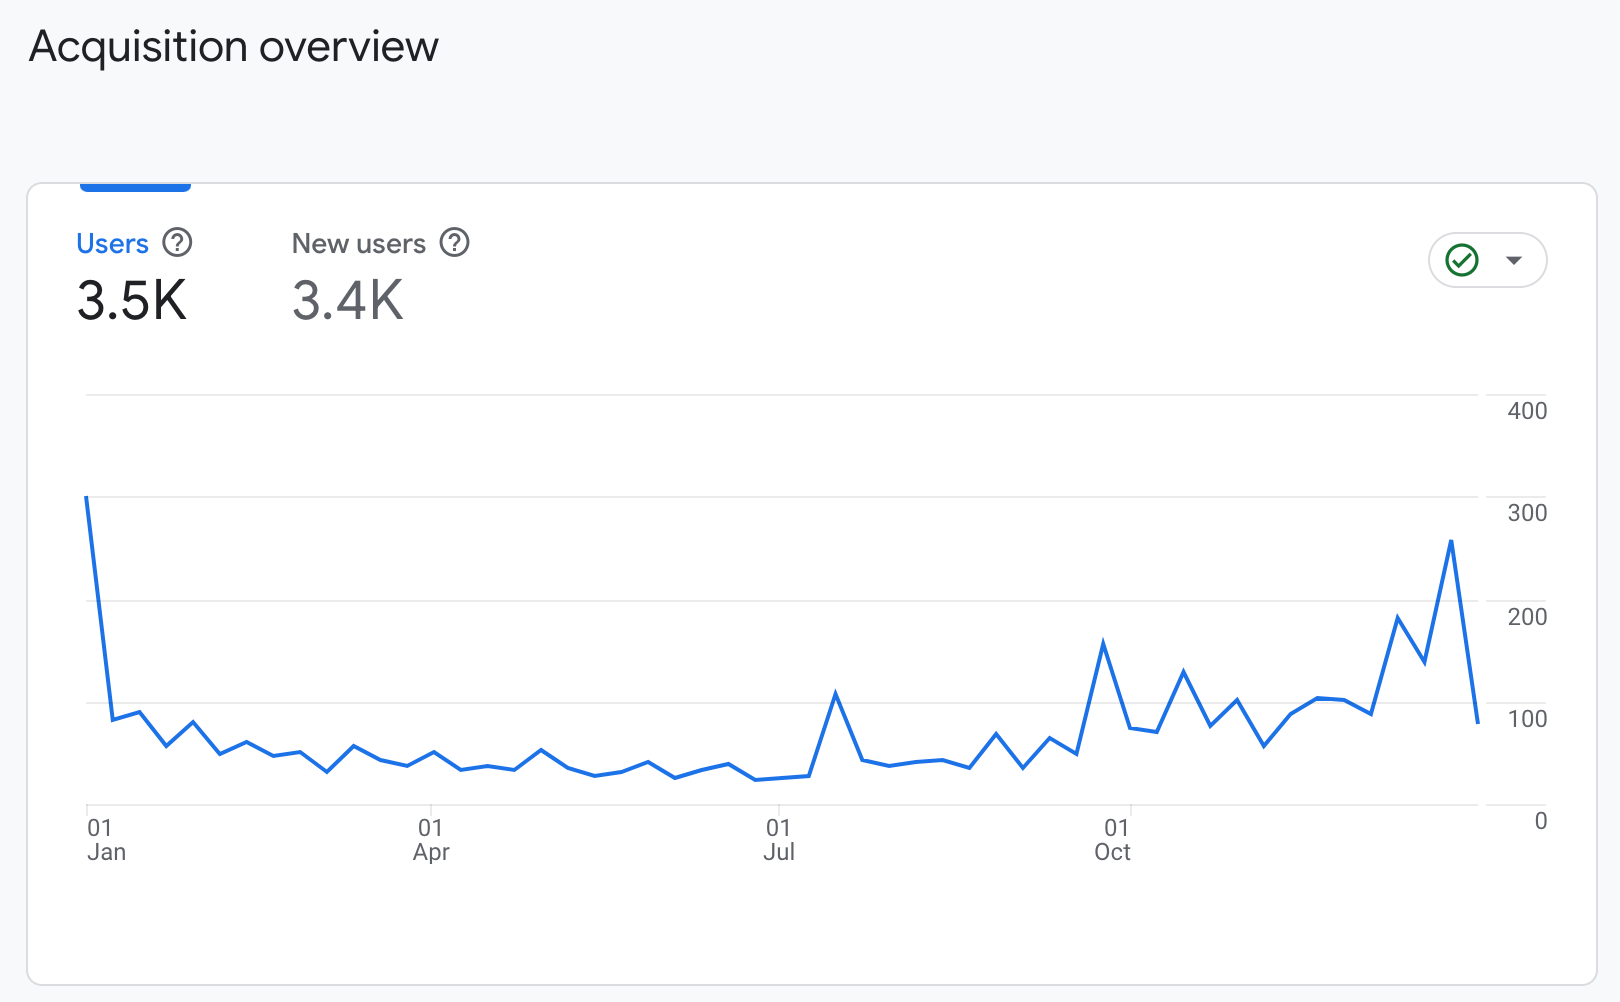
The more users you see listed here = greater reach!
I recommend tracking this month over month so that you can accurately see growth over time. 📈
You can also run a report comparing this year to last year by clicking the “add comparison” button and selecting your date ranges. This is one of my personal favorite features!
WHERE IS MY WEBSITE TRAFFIC COMING FROM?
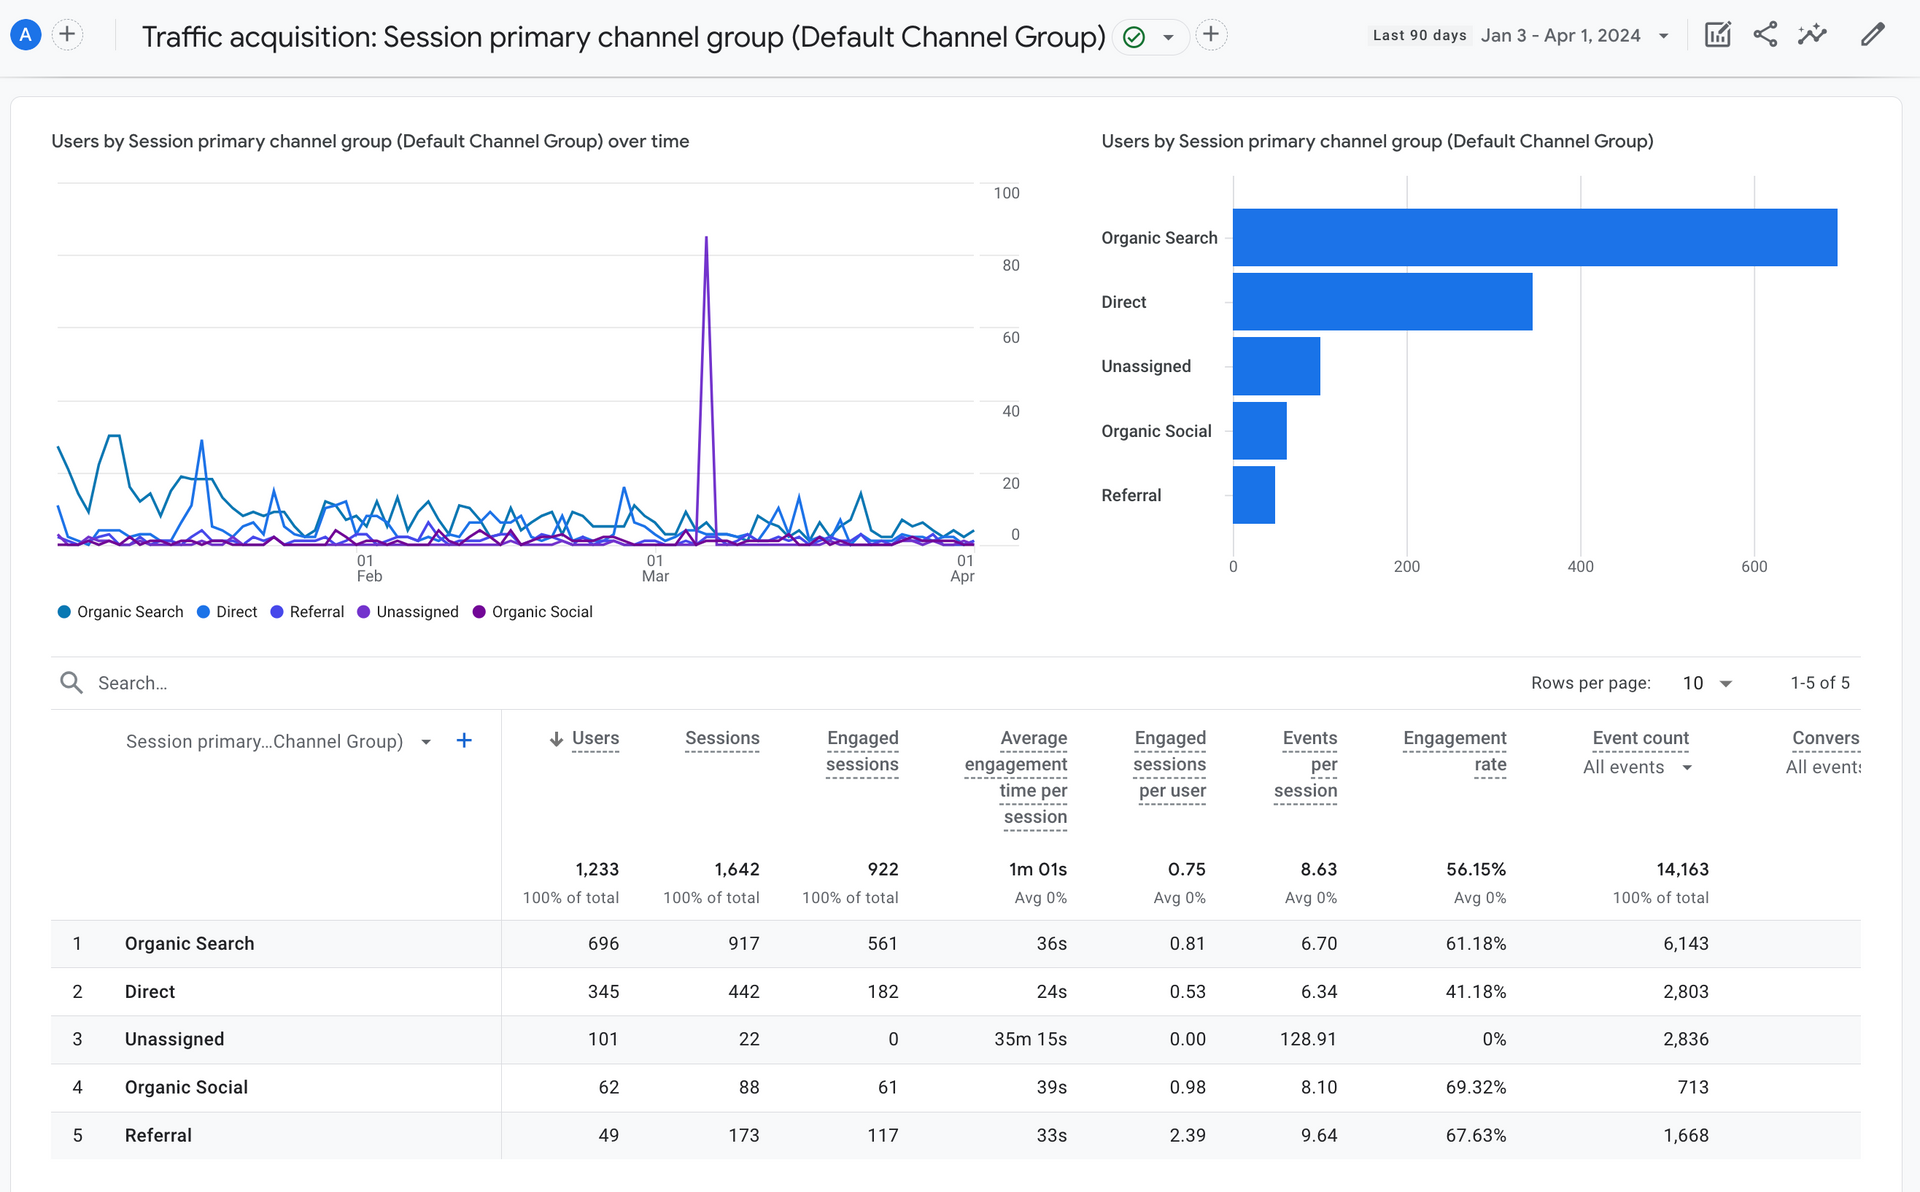
To find this information, navigate to Reports > Life Cycle > Acquisition > Traffic Acquisition.
This helps you learn the ways someone has found your website, whether it be direct (meaning they type the url directly into a browser window), organic search, social media, email or other efforts.
AM I REACHING MY IDEAL AUDIENCE?
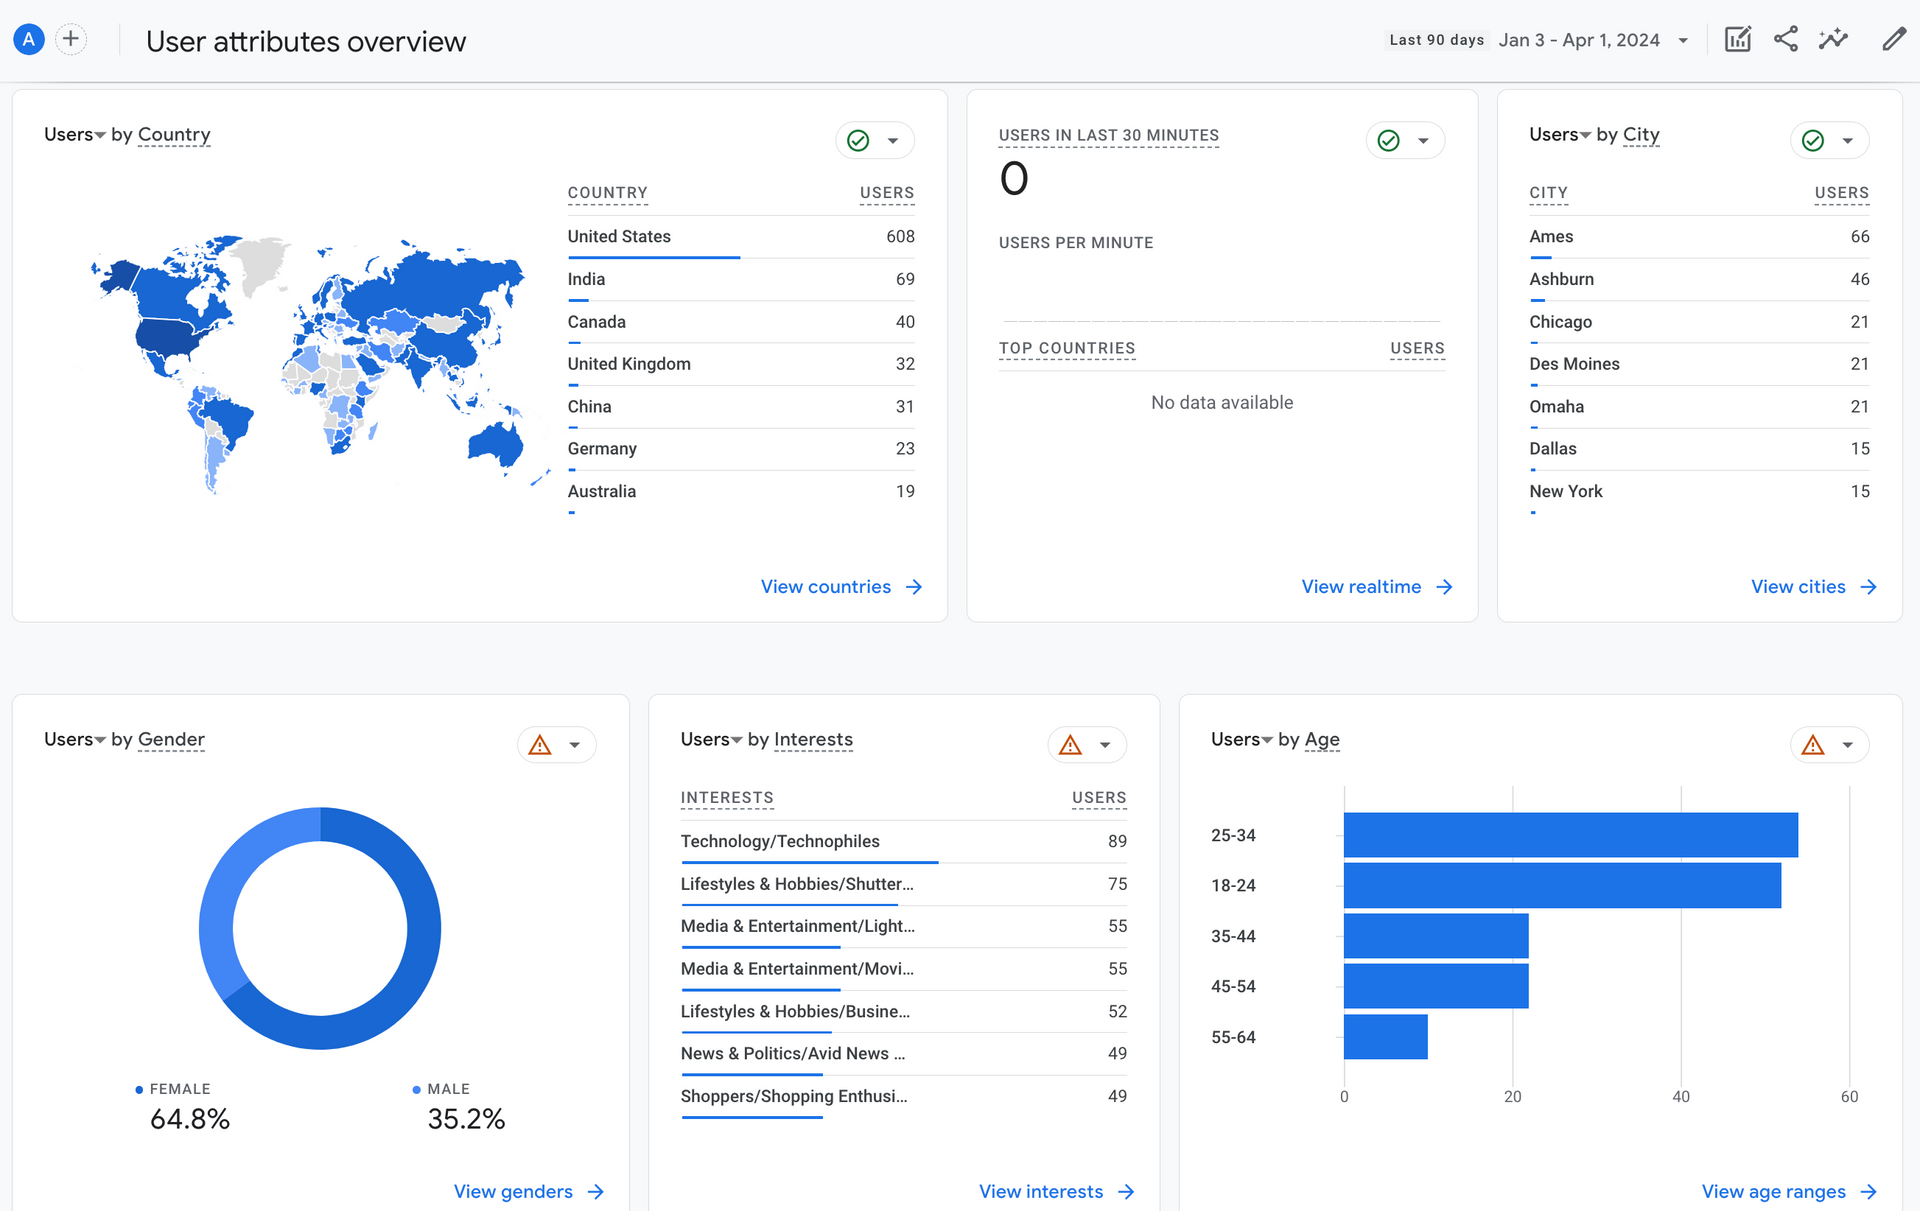
Once you know that your website is effectively attracting people, you’ll likely begin to wonder… are they the RIGHT people?
To get a closer look at this, you can navigate to User Attributes > Overview. Here you’ll find important demographics, such as location, age and even interests.
If you’re having trouble finding this information within your Google Analytics Dashboard, there is a threshold that needs to be met in order for Google to track this and you can
find more info on that here.
HOW LONG ARE VISITORS STAYING ON MY WEBSITE?
Getting people to your website is one thing, but making sure they stay around is another!
To get a closer look at this data, you can navigate to Reports > Life Cycle > Acquisition > Traffic Acquisition and look closely at Engagement Rate.
Engagement rate tracks how much an audience actively engages with your content. A good engagement rate is around 60-70%.

WHAT ARE MY VISITORS CLICKING ON MY WEBSITE?
It’s important to understand the types of action that people are taking on your website, so being able to see this data is very valuable!
To have a better understanding of what people are clicking on your website, you can navigate to Engagement > Events.
This section of data will tell you if they’re scrolling, clicking play on a video, clicking a specific button on a certain page, filling out a form, etc.
Knowing this information can allow you to adjust your website pages as needed to ensure that your visitors are being led to actions that are aligned with your goals!
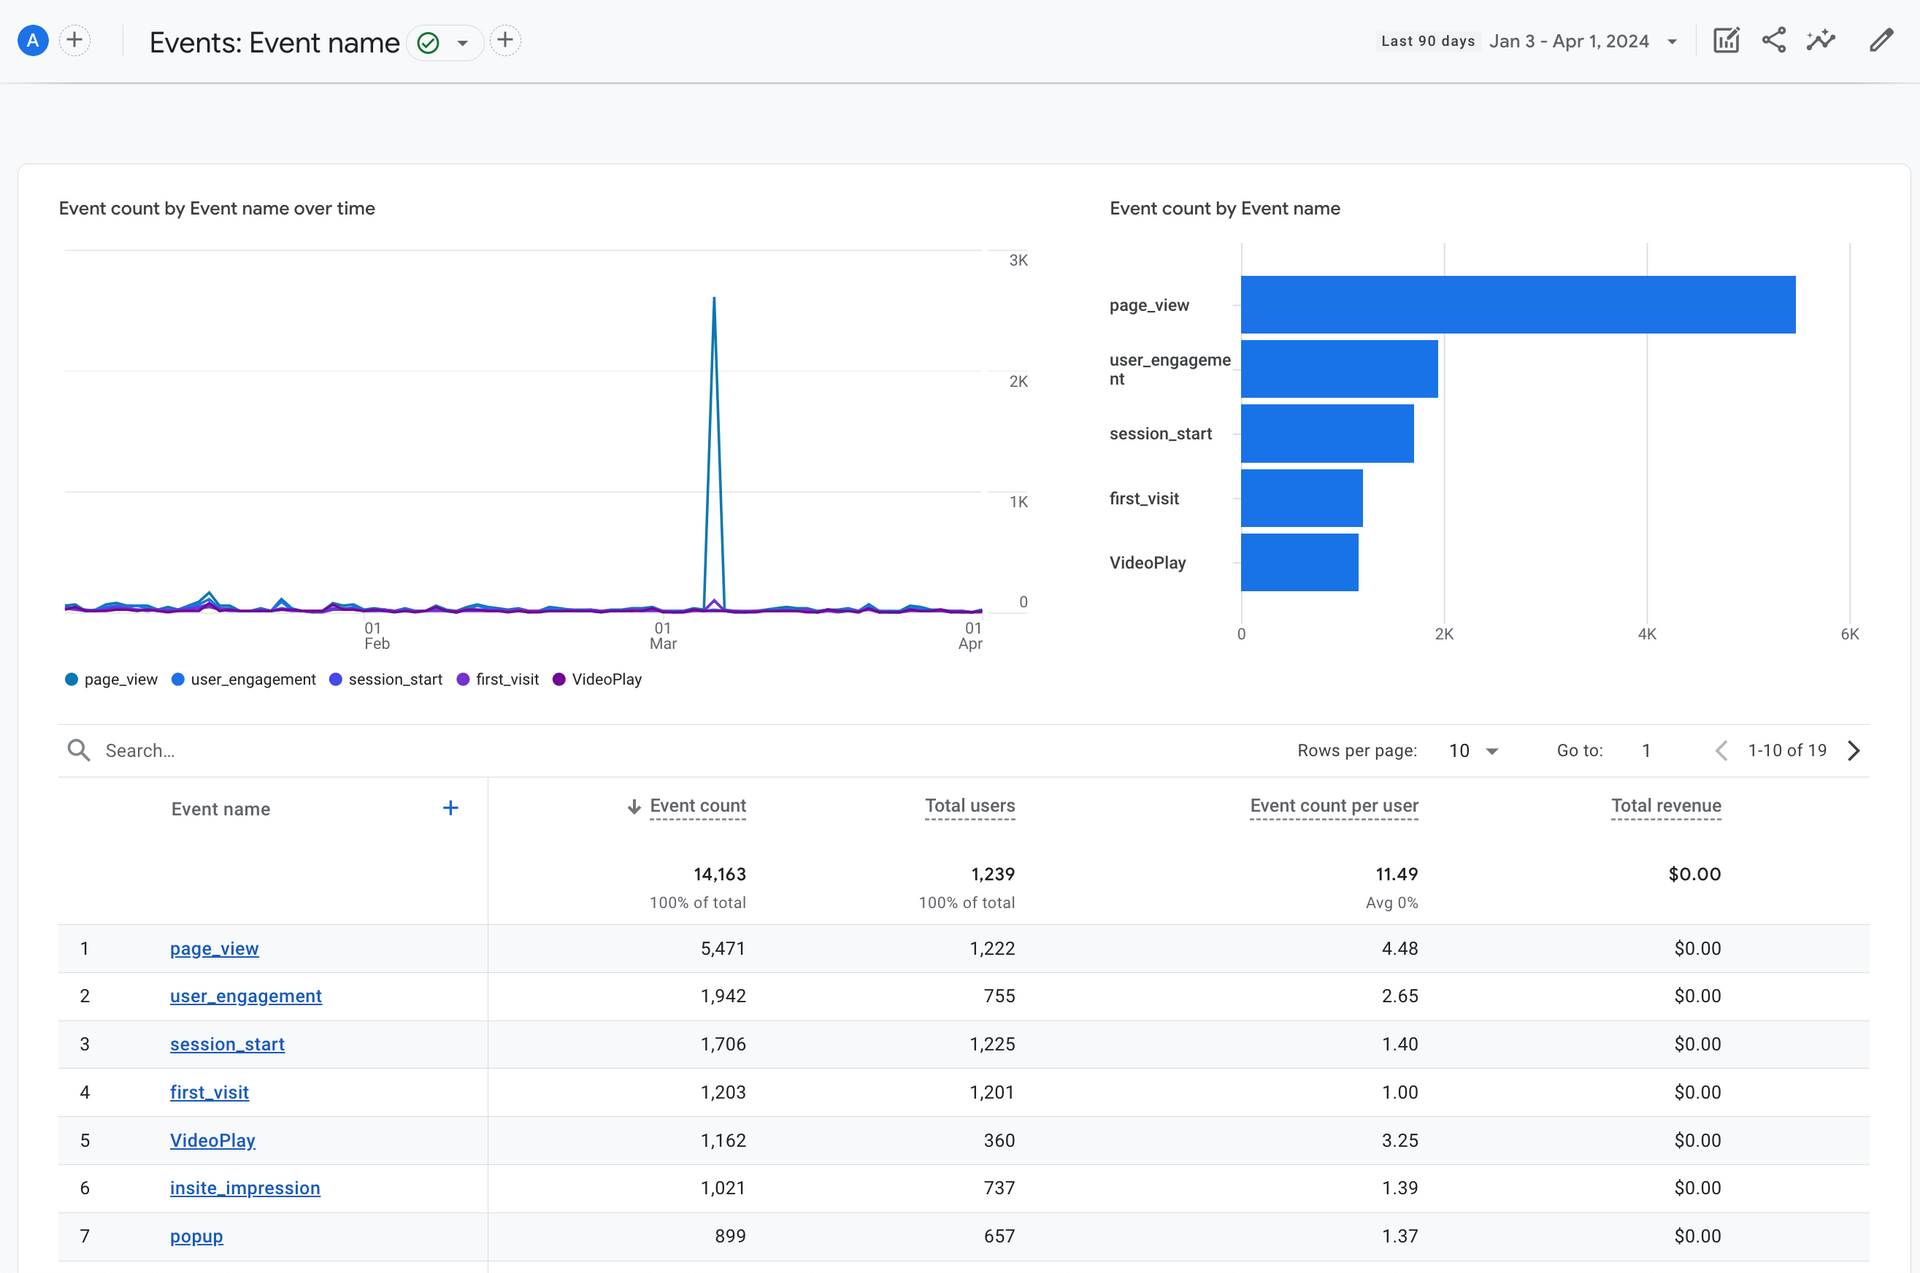
WHAT PAGES OR BLOG CONTENT PIECES ARE MOST VISITED?
In addition to knowing the actions that your users are taking, it’s nice to know what pages your visitors are navigating to the most. To find this information, you can navigate to Engagement > Pages and Screens.
This can help you know which pages are most attractive to your website users and what blog content is the most popular, so you can better determine your efforts for future content!
Personally, I keep track of every blog post each week, so I always know what is performing well and can adjust as needed!
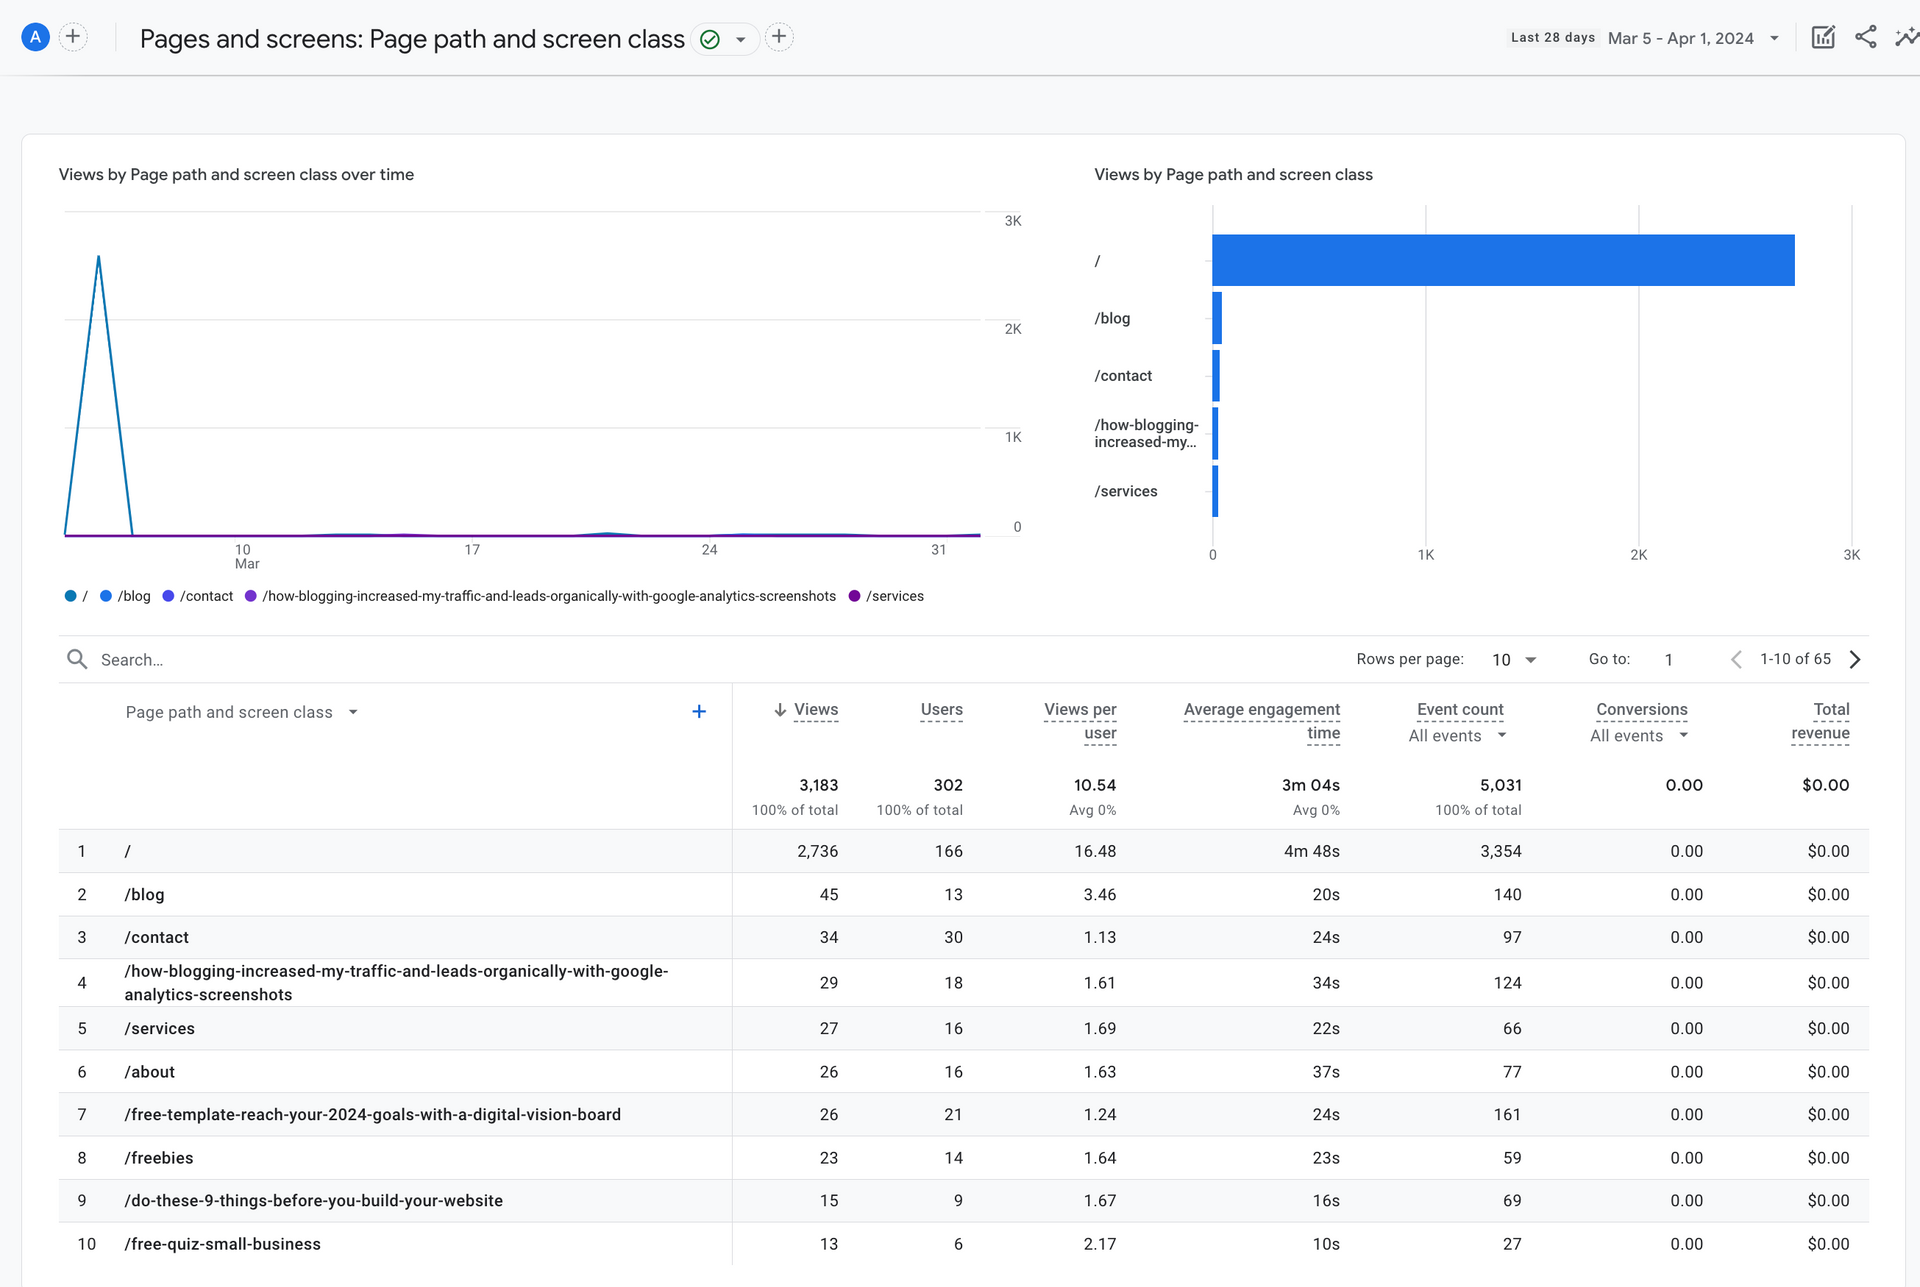
Remember, these are just a few of the most common things that people typically want to track when it comes to their website, but Google analytics can give you insight to SO much more data depending on what you want to know specifically.
If you’re just getting started with tracking your data, I highly recommend starting here first!
HOW TO TRACK YOUR WEBSITE METRICS CONSISTENTLY WITH EASE
Now that you have a general idea of what website metrics to track inside of Google Analytics, you’re likely wondering HOW exactly you do this.
And I’ll be honest – there’s not just *one* right way to track your data.
How you track your website metrics really comes down to what works for you specifically.
Everyone absorbs information differently and the key here is that you implement the option that you’re actually going to look at and use on a consistent basis.
For example, how many times have you tried to implement a strategy or tactic that someone shares on Instagram just to find that you really don’t vibe with it at all?
It’s sort of like when someone that’s a tried and true paper planner person tries to switch to digital and it disrupts their whole life.
That is not the goal here!
With that said, here are some options for how to track your website metrics:
USE THE PLAIN ‘OLE GOOGLE ANALYTICS DASHBOARD
Some people prefer to simply use the Google Analytics dashboard that’s provided for them to keep up with their analytics on a consistent basis. And if that’s the route you choose, that’s totally cool!
With this option, you would simply navigate to Google Analytics each time you want to check your metrics and navigate the dashboard from there.
So that Analytics starts tracking your data properly, when you first launch your site, you simply have to add a small snippet of code (I promise it’s easy), so that Google can do its thing.
Check out
these
easy instructions
on how to do that!
Once the platform starts tracking your data, you can login at any time to see your website's performance.
CREATE A HANDY DANDY SPREADSHEET
If you’d rather not have to rely solely on the Google Analytics dashboard itself, you can make a handy dandy metrics spreadsheet to keep track of everything that you’re specifically interested in on an ongoing basis.
This is the option I choose solely because I like to be able to glance at everything in one place since the Google Analytics dashboard itself can be a little overwhelming if you don’t know what you’re looking at.
The spreadsheet I created is nothing fancy and gets the job done!
If you’re interested in using a similar method,
CLICK HERE to make a copy to use for yourself.
GET FANCY WITH A CUSTOMIZED DASHBOARD IN LOOKER STUDIO
And then, some people want to get a little extra fancy and create a customized dashboard using another amazing (and free) tool,
Looker Studio.
Looker Studio turns your data that’s originally tracked and collected by Google Analytics into informative, easy to read, easy to share, and fully customizable dashboards and reports.
This is a great option if you’re really only interested in looking at certain data regarding your website and aren’t worried about the rest.
I know a few people who have chosen this route and it seems to work well! I’m not an expert in this arena, but
here’s a great resource.
If this is something you prefer, just know that it will likely take longer to set up and customize the dashboard, so it may not be the thing that you start with first, but you could add it to your list to look into later!
WHAT TO DO WITH YOUR WEBSITE METRICS ONCE YOU HAVE THEM
Now that you know what metrics to track, what they mean, and how to do it, you’re probably wondering…
“What exactly do I do with all of this data?!”
And that’s a great question. Because you don’t want to just track data for no reason – instead, you want to turn around and actually do something with it.
The way I want you to think about your website data is that it’s sort of like the answers to a test.
If you’re wondering how many viewers your website attracts each month, the data will tell you. If you’re wondering what page gets the most views, the data will tell you. If you’re wondering how long someone stays on your site, the data will tell you.
The data will truly tell you everything so you can have actionable insights that inform your decisions.
Remember how I mentioned that once you launch your website, you can then tweak, refine, and refresh? Well, knowing the data is how you do it!
Without it, you won’t know what to tweak, refine, or refresh.
To use your website metrics most effectively, you must go back to the GOALS that you have for your website. And no, not everyone has the same website goals!
Is it to directly book more clients or discovery calls? Is it to drive more email subscribers? Is it to improve your blog readership?
The goal of your website comes down to the personal strategy that you’ve created and every website should be rooted in one.
(If that sounds complex to you and you aren’t sure how to build a website that’s backed in strategy, that’s exactly what I help my clients do!
Click here to learn more about my website design services.)
Once you know your goal, you can then use your data to tell you if that goal is being achieved! And if it’s not? THAT is when you can decide to make specific tweaks.
DONE-FOR-YOU WEBSITE STRATEGY AND DESIGN
If you already have a website that you use and love, I
LOVE
that for you! My advice is to make sure you’re tracking your metrics consistently and making tweaks and updates as needed to keep it working for you.
And if you’re not a fan of the website you have OR if you’re in need of one from scratch, you’ve landed in the right place.
With my website design service, you’ll receive:
- 1:1 strategy session to provide clarity and direction for the content, calls-to-action and conversion goals
- Customized messaging and visuals to give your audience a first impression that will knock their socks off
- A focus on taking a visitor on a journey through your website to maximize buy-in
- Competitor research so your audience finds you first
- Keywords, linking strategies, SEO titles, descriptions, heading tags and more to ensure your website has a healthy relationship with Google
- Navigable page designs for simple usability
- Coaching call so you can get prepare and plan for your audience to get excited about your new website
- Post launch support after your big launch
- Annual hosting, security certificate and an email support line that goes straight to me for added peace of mind
- A simple user log-in to edit your website along with training video tutorials so you have the freedom to make updates anytime
CLICK HERE to connect to see if a website design project is a good fit for you!
Your designer friend always,

The A-List is your 60-second inbox scroll for local brand and website tips, savvy small biz resources and the take-aways you need to get through this crazy thing called entrepreneurship.
Join the email community!
Email Community Signup
BLOG TOPICS
BROWSE RECENT POSTS
I get to use creativity everyday to help entrepreneurs focus on their passions to discovering their brand's "sweet spot" in the marketplace...and I absolutely LOVE IT!
I'd love to connect with you to chat more about your business.


